The Best & Worst U.S. Cities for Sleep

- Among the top 75 U.S. cities by population, Portland, Oregon, rates as the best city for sleep with the lowest percentage of insufficient sleepers (26.2% averaging less than 7 hours of sleep a night – 6.5% lower than the national average).
- Detroit, Michigan, rates the worst city for sleep with nearly half (45.6%) of residents not getting at least 7 hours of sleep per night.
- California boasts some of the top-sleeping and healthiest cities on our list: San Francisco has the lowest percentage of residents with obesity, San Jose has the lowest percentage with depression, and Irvine has the lowest percentage who lack health insurance and time for exercise.
- Three Ohio cities are among the bottom 10 with the highest percentage of insufficient sleepers: Toledo (40%), Cincinnati (43%), and Cleveland (43%).
- Environmental factors can impact a city’s sleep. Top-sleeping cities Seattle, San Jose, and San Francisco are among those with the least amount of light and air pollution. Lincoln, Nebraska, is one of the quietest cities. Of our 10 worst-sleeping cities, Newark, New Jersey, is among the noisiest.
- Socioeconomic factors can play a role in a city’s sleep too. Top-sleeping Minneapolis has one of the lowest unemployment rates while poor-sleeping Detroit has one of the highest.
- Five of our worst-slept cities are also among the top 20 cities with sleep-disrupting bed bugs: Philadelphia, Cleveland, Cincinnati, Detroit, and Baltimore.
Where you live can impact numerous factors: your lifestyle, job, friends, mental health, physical health, and even your sleep. Yes, the city you reside in may actually have something to do with how well (or poorly) you snooze.
According to the Centers for Disease Control and Prevention, adults aged 18–60 should get at least 7 hours of sleep per night, and more than one-third of Americans are not hitting this magic number. They’re regularly getting insufficient sleep, and their health and physical environment could be partially to blame.
Where Sleep Meets Health in Your City
We know that the quality of our sleep and overall health and well-being have a bidirectional relationship — our sleep (or lack of it) can affect our health, and our health can affect our sleep. Insufficient shut-eye can carry an increased risk of a range of diseases and health problems, including obesity, cardiovascular disease, high blood pressure, diabetes, stroke, and poor mental health.
While all towns in America sleep differently, specific health and environmental factors come into play when determining why some cities sleep better, and others sleep worse, according to Melissa Milanak, Ph.D., founder of MIND Impact Consulting and an associate professor at the Medical University of South Carolina.
“Where you live definitely has an effect on your sleep. So, if we think about the factors that can impact sleep, temperature, for instance, is one of those. We want your bedroom environment to be cold when you’re sleeping, but cold can be relative, say, if you’re living in Alaska versus living in Arizona or in Florida,” she notes. “Altitude is a big one that people don’t always think about — if your body is working harder to get oxygen, that could impact your sleep and increase daytime sleepiness. Temperature, humidity, altitude, noise pollution, air quality, and light pollution can all have a significant impact.”
Milanak adds that socioeconomic factors in different cities can also affect the quality of our sleep. “Do you have access to resources? Do you have a comfortable bed that has the right firmness or is going to support the right spine position? Also consider the types of jobs people are working and those who might take public transportation or have longer commute times,” she says. “Sleep can also be affected by the amount of leisure time you have to exercise or decompress. Then there’s also access to insurance and healthcare in general. Some people don’t have preventative care or insurance to go in and get regular checkups.”
How We Ranked Cities
Using health metric data from the CDC and the 2020 U.S. Census (looking at the 75 largest U.S. cities by population), we determined the best and worst cities for sleep based on the percent of the population with insufficient sleep. Those cities with the lowest percentages of insufficient sleepers comprise our top 10 best cities. Those with the highest percentage of poor sleepers make up the 10 worst cities for sleep.
We further explore the relationship between a population’s sleep habits and certain health indicators. For the purpose of this list, we examine why a city might fall within this ranking by taking a close look at 5 factors representative of these health indicators as reported by U.S. adults:
- Lack of health insurance: People who don’t have healthcare insurance coverage are less likely to have access to healthcare and more likely to have poor health and chronic conditions like diabetes that can impact sleep.
- Colon cancer screening: This is one indicator that people have access to preventive screenings and have the means to complete the screenings. Regular checkups are essential for maintaining overall health.
- Lack of leisure time for exercise: Regular exercise can benefit a person’s health and well-being as well as improve sleep. Not having enough time to exercise can raise the risk of heart disease, cancer, and other health conditions.
- Obesity: Having obesity increases the risk of several chronic conditions as well as insomnia and other sleep issues.
- Mental health: Depression and sleep are interconnected, meaning a lack of sleep can worsen depression, and people with depression often have sleep problems.
We compare the cities’ data to the U.S. average and determine whether or not the factor is a pro or con (above or below the U.S. average) in terms of health and sleep.
U.S. Averages for Sleep and Five Health Indicators
- Less than 7 hours of sleep: 32.7%
- Lack of health insurance: 10.8%
- Colon cancer screenings: 72.4 %
- Residents who have leisure time for exercise: 76.3%
- Obesity: 33%
- Depression: 19.5%
The 10 Best Cities for Sleep
1. Portland, OR

Population with less than 7 hours of sleep: 26.2%
| Pros | Cons |
|---|---|
| Low rate of uninsured patients: 7% Better than average colon cancer screenings: 72.5% Most residents have time to exercise: 83.3% Low rate of obesity: 25.6% | Comparatively high rate of depression: 26.8% |
Additional insights: According to CDC data, much of the Portland population is consistently pretty healthy, with arthritis, high blood pressure, instances of cancer, and diabetes all lower than the U.S. average, and for good reason: Portland is one of the most bike-friendly cities in the country according to Walk Score, and physical activity often equals good sleep.
2. Seattle, WA

Population with less than 7 hours sleep:26.5%
| Pros | Cons |
|---|---|
| Low rate of uninsured patients: 6% Better than average colon cancer screenings: 74.9% Most residents have time for exercise: 86.8% Low rate of obesity: 23.6% | Relatively high rate of depression: 24.3% |
Additional insights: Not sleepless in Seattle here. In addition to its lush landscape perfect for ample outdoor activity, Seattle has less light and air pollution than many major U.S. cities, making for a better night’s sleep — and an excellent opportunity for stargazing!
3. Minneapolis, MN

Population with Less than 7 hours of sleep: 26.9%
| Pros | Cons |
|---|---|
| Low rate of uninsured patients: 8.8% Better than average colon cancer screenings: 72.6% Most residents have time for exercise: 80.1% Low rate of obesity: 29.5% | Comparatively high rate of depression: 25.1% |
Additional insights: Minneapolis is a highly walkable (and bike-friendly) city and also boasts some of the cleanest air in the world, according to IQAir, making for a more restful night. In addition, Minneapolis’ unemployment rate is relatively low — 2.7% in September 2023, lower than the national average of 3.9%, making for less stress and better sleep.
4. Denver, CO

Population with less than 7 hours of sleep: 27.4%
| Pros | Cons |
|---|---|
| Most residents have time for exercise: 82.6% Low rate of obesity: 22.1% | Relatively high rate of uninsured patients: 14.2% Worse than average colon cancer screenings: 72% High rate of depression: 22% |
Additional insights: Despite its high altitude (which typically correlates with poor sleep), Denver ranks fourth on our list and has a highly active population, along with some of the cleanest air in the entire world, allowing folks to breathe easier at night.
5. Lincoln, NE

Populations with less than 7 hours of sleep: 27.8%
| Pros | Cons |
|---|---|
| Low rate of uninsured patients: 8% Most residents have time for exercise: 79.9% | Worse than average colon cancer screenings: 71.4 % High rate of obesity: 33.2% Comparatively high rate of depression: 19.9% |
Additional insights: Located in the heart of the Midwest, Lincoln is one of the quietest cities in the U.S. Noise can disturb our sleep, even if it doesn’t fully wake us. With less urban noise, residents of Lincoln can benefit from sounder sleep.
6. San Jose, CA

Population with less than 7 hours of sleep: 28.8%
| Pros | Cons |
|---|---|
| Low rate of uninsured patients: 9.8% Most residents have time for exercise: 81.6% Low rate of obesity: 20.9% Low rate of depression: 14.9% | Worse than average colon cancer screenings: 61.9% |
Additional insights: San Jose has the lowest percentage of residents with depression in our round-up, and it also has relatively low light pollution, both indicators that can contribute to consistently quality sleep.
7. San Francisco, CA

Population with less than 7 hours of sleep: 29%
| Pros | Cons |
|---|---|
| Low rate of uninsured patients: 6.6% Most residents have time for exercise: 82.2% Low rate of obesity: 19% Low rate of depression: 15.9% | Worse than average colon cancer screenings: 61.4% |
Additional insights: The most walkable city in the U.S., San Francisco is also the city with the lowest percentage of residents with obesity listed here, according to CDC data. Good health and good sleep go hand-in-hand.
8. Omaha, NE

Population with less than 7 hours of sleep: 29%
| Pros | Cons |
|---|---|
| N/A | Relatively high rate of uninsured patients: 10.9% Worse than average colon cancer screenings: 71% Fewer residents have time for exercise: 75.5% High rate of obesity: 35.9% Relatively high rate of depression: 19.6% |
Additional insights: At first glance, Omaha doesn’t have health factors in its favor. But a closer look shows that the health indicators are just slightly worse than the U.S. average. The city is better than the U.S. average when it comes to major health conditions, including heart disease (4.7% compared with the U.S. average of 6.1%), diabetes (9.2% versus 11.3%), and cancer (5.8% versus 7.0%). These factors may help explain why the city is one of the better-slept.
9. Irvine, CA

Population with less than 7 hours of sleep: 30.1%
| Pros | Cons |
|---|---|
| Low rate of uninsured patients: 5.2% Most residents have time for exercise: 87% Low obesity rate: 20.7% Low rate of depression: 16% | Worse than average colon cancer screenings: 64% |
Additional insights: Of all the cities on our list, Irvine boasts more folks who have health insurance than any other, in addition to more leisure time for physical activity, making for improved sleep health.
10. Austin, TX

Population with less than 7 hours of sleep: 30.2%
| Pros | Cons |
|---|---|
| Most residents have time for exercise: 81.5% Low rate of obesity: 28.2% | Relatively high rate of uninsured patients: 18.5% Worse than average colon cancer screenings: 68.3% Relatively high rate of depression: 22.4% |
Additional insights: Austin rounds out our top 10 cities for good sleep health. Its relatively low light and air pollution and ample leisure time for its residents are contributing factors.
10 Worst Cities for Sleep
1. Detroit, MI
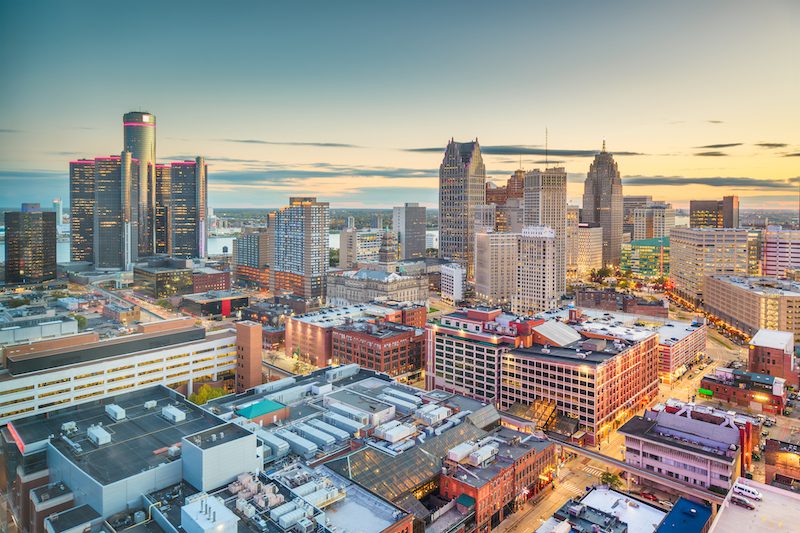
Population with less than 7 hours of sleep: 45.6%
| Pros | Cons |
|---|---|
| N/A | Relatively high rate of uninsured patients: 13.9% Worse than average colon cancer screenings: 70.5% Fewer residents have time for exercise: 62.6% High rate of obesity: 45.5% Relatively high rate of depression: 21% |
Additional insights: The worst city for sleep is Detroit, with light pollution being a contributing factor and all of our health indicators being worse than the U.S. average. Obesity and lack of leisure time are issues in Detroit more than any other town in our ranking, which could be attributed to some socioeconomic factors. For instance, its unemployment rate was 4.5% in October 2023, higher than the 3.9% national average.
2. Cleveland, OH
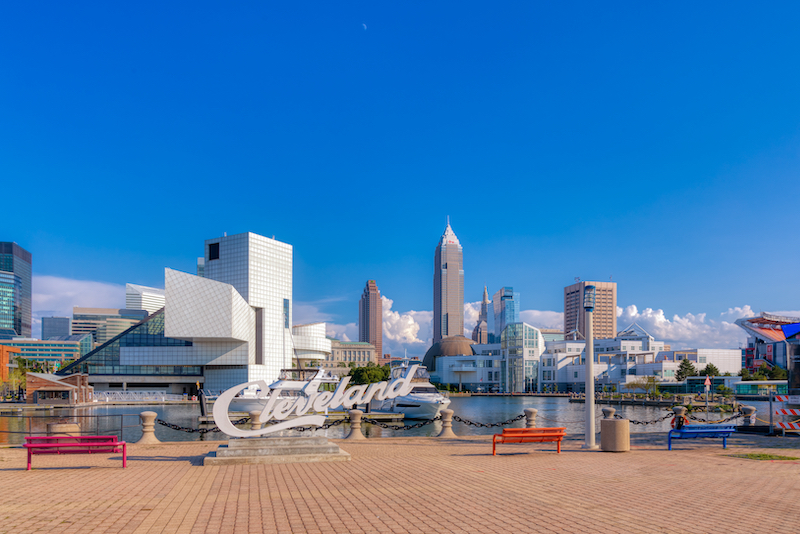
Population with less than 7 hours of sleep: 43%
| Pros | Cons |
|---|---|
| N/A | Relatively high rate of uninsured patients: 13.8% Worse than average colon cancer screenings: 67.2% Fewer residents have time for exercise: 65.1% High rate of obesity: 41.9% Relatively high rate of depression: 24% |
Additional insights: Much like Detroit, Cleveland’s health indicators are all worse than the U.S. average, with poor physical health being reported at 16.8% of the population, more than any other city ranked. And according to a 2023 study by Terminix, Cleveland is the fourth worst city for bed bugs, making it pretty challenging to get a good night’s sleep.
3. Newark, NJ

Population with less than 7 hours of sleep: 42.8%
| Pros | Cons |
|---|---|
| Relatively low rate of depression: 18.9% | Relatively high rate of uninsured patients: 24.1% Worse than average colon cancer screenings: 65% Fewer residents have time for exercise: 63.8% High rate of obesity: 38.2% |
Additional insights: Newark is ranked as one of the noisiest cities in the U.S., which can contribute to many of its residents getting less than the recommended 7 hours of sleep per night. Of the cities listed, Newark also has the most people lacking both health insurance (24.1%) and access to preventative health screenings (35%).
4. Cincinnati, OH

Population with less than 7 hours of sleep: 41.4%
| Pros | Cons |
|---|---|
| Relatively low rate of uninsured patients: 10.1% | Worse than average colon cancer screenings: 70.4% Fewer residents have time for exercise: 69.4% High obesity rate: 38.6% High rate of depression: 22.2% |
Additional insights: One of three Ohio towns on our “Worst U.S. Cities for Sleep” list, Cincinnati is also in the top ten list of cities (along with Cleveland) with the highest number of reported bed-bug cases, as determined by Terminix. That, combined with the worse-than-average health factors, can make for restless nights.
5. Toledo, OH

Population with less than 7 hours of sleep: 40%
| Pros | Cons |
|---|---|
| N/A | Relatively high rate of uninsured patients: 11.7% Worse than average colon cancer screenings: 68.5% Fewer residents have time for exercise: 65.4% High rate of obesity: 44.2% Relatively high depression rate: 24.9% |
Additional insights: Our third Ohio city, Toledo, lists all of our health indicators as being worse than the U.S. average, including lack of leisure time, those with no health insurance, obesity, and depression.
6. Baltimore, MD
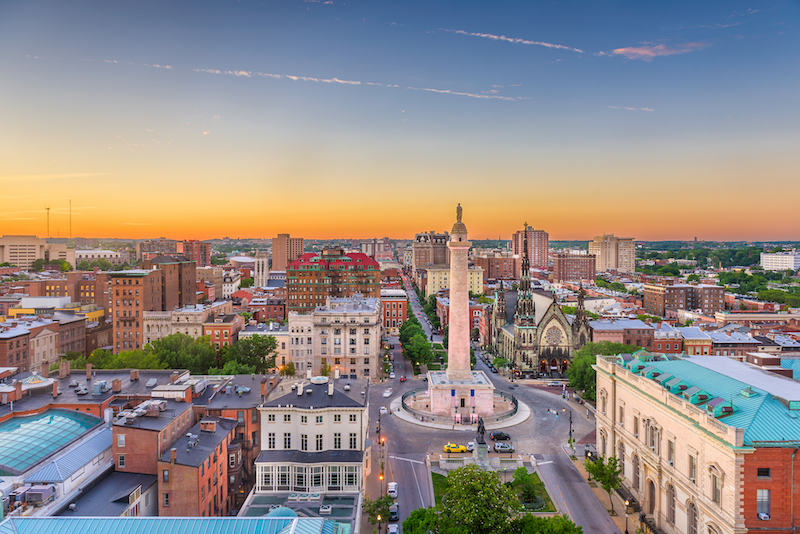
Population with less than 7 hours of sleep: 39.7%
| Pros | Cons |
|---|---|
| N/A | Relatively high rate of uninsured patients: 11.2% Worse than average colon cancer screenings: 71% Fewer residents have time for exercise: 71.6% High rate of obesity: 36.4% Relatively high depression rate: 20.5% |
Additional insights: Besides all health factors listed being worse than the U.S. average, Baltimore isn’t faring much better on the bed-bug front due to its placement in the top 25 U.S. cities with reported cases from Terminix’s 2023 study. Worrying about bed bugs can wreck sleep.
7. Buffalo, NY
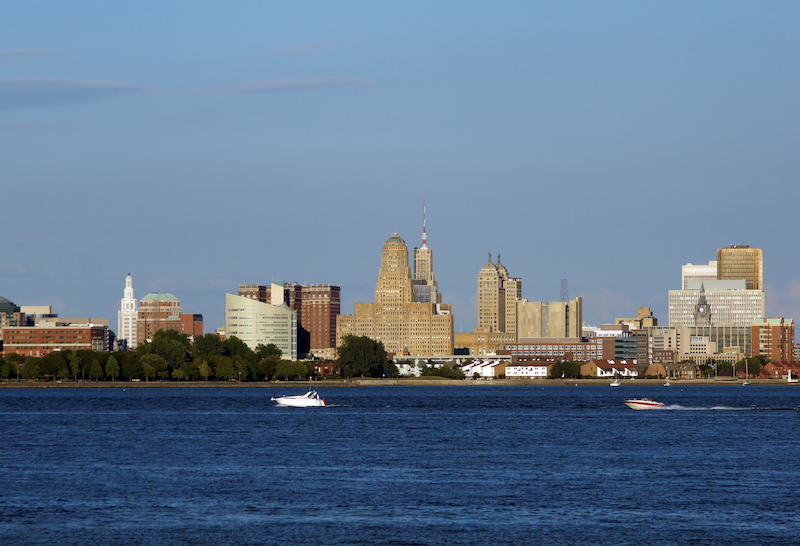
Population with less than 7 hours of sleep: 39.3%
| Pros | Cons |
|---|---|
| Relatively low rate of uninsured patients: 9.2% | Worse than average colon cancer screenings: 70.2% Few residents have time for exercise: 67.6% High obesity rate: 40.6% Relatively high rate of depression: 25.3% |
Additional insights: Despite its frigid winters and frequent snow storms (a cooler sleep environment often equates to good shut-eye), Buffalo is lacking in sleep. Many of its residents have depression (25.3% as compared to the U.S. average of 19.5%), which has a proven bidirectional relationship with sleep quality.
8. New Orleans, LA

Population with less than 7 hours of sleep: 39.2%
| Pros | Cons |
|---|---|
| Relatively low rate of uninsured patients: 10.1% | Worse than average colon cancer screenings: 70.2% Fewer residents have time for exercise: 75.1% High rate of obesity: 34% High rate of depression: 24.3% |
Additional insights: New Orleans is known for hosting the biggest party of the year (hello, Mardi Gras), and for needing more sleep. Alongside the mentioned health indicators, it doesn’t help that NOLA’s median household income ($61,602 in 2022) is less than the national average ($74.755), likely leading to more stress and insomnia.
9. Philadelphia, PA

Population with less than 7 hours of sleep: 38.5%
| Pros | Cons |
|---|---|
| Comparatively low rate of obesity: 31.1% | Relatively high rate of uninsured patients: 11.4% Worse than average colon cancer screenings: 71% Fewer residents have time for exercise: 69.2% High rate of depression: 22% |
Additional insights: Besides not getting enough sleep, Philadelphia is worse than average when it comes to participating in certain health risk behaviors. This includes binge drinking (17.4% compared with the U.S. average of 15.5%), smoking (19.5%, while the U.S. average is 13.5%), and a lack of leisure time (30.8%, with 23.7% being the U.S. average). These can all contribute to poor health, which means not-so-great sleep. The City of Brotherly Love is also the worst city for bed bugs.
10. Kansas City, MO

Population with less than 7 hours of sleep: 38.4%
| Pros | Cons |
|---|---|
| N/A | Relatively high rate of uninsured patients: 14.2% Worse than average colon cancer screenings: 69.4% Fewer residents have time for exercise: 73.7% High rate of obesity: 40.7% Relatively high rate of depression: 22% |
Additional insights: Like Detroit, Cleveland, Toledo, and Baltimore, Kansas City scored worse than average across all the relevant health indicators. The Midwestern city is also not known to be very walkable or bike-friendly. This could contribute to increased obesity and poor overall health, resulting in a poor night’s sleep.
Got a hot tip? Pitch us your story idea, share your expertise with SleepFoundation.org, or let us know about your sleep experiences right here.
Tina is a freelance writer and editor based in Jacksonville, Florida, and specializes in entertainment, lifestyle, and parenting content. She has written and reported for a variety of publications and websites including MTV News, ET Online, Glamour, Us Weekly, and more.
References14 Sources
Pankowska MM, Lu H, Wheaton AG, Liu Y, Lee B, Greenlund KJ, et al. Prevalence and Geographic Patterns of Self-Reported Short Sleep Duration Among US Adults, 2020. Prev Chronic Dis 2023;20:220400., Retrieved Nov 30, 2023 from
https://www.cdc.gov/pcd/issues/2023/22_0400.htmBasner, M., Smith, M. G., Jones, C. W., Ecker, A. J., Howard, K., Schneller, V., Cordoza, M., Kaizi-Lutu, M., Park-Chavar, S., Stahn, A. C., Dinges, D. F., Shou, H., Mitchell, J. A., Bhatnagar, A., Smith, T., Smith, A. E., Stopforth, C. K., Yeager, R., & Keith, R. J. (2023). Associations of bedroom PM2.5, CO2, temperature, humidity, and noise with sleep: An observational actigraphy study. Sleep health, 9(3), 253–263.,, Retrieved Nov. 30, 2023, from
https://pubmed.ncbi.nlm.nih.gov/37076419/PLACES: Local Data for Better Health. (2023). Centers for Disease Control and Prevention., Retrieved Nov. 30, 2023, from
https://places.cdc.gov/City and Town Population Totals: 2020-2022. (2023) United States Census Bureau., Retrieved Nov. 30, 2023, from
https://www.census.gov/data/tables/time-series/demo/popest/2020s-total-cities-and-towns.htmlCities & Neighborhoods. (2021). Walk Score., Retrieved Nov. 30, 2023, from
https://www.walkscore.com/cities-and-neighborhoods/Urban Stargazing: These Are the Best Cities for Seeing the Stars. (October 2022) Unforgettable Travel Company., Retrieved Nov. 30, 2023, from
https://unforgettabletravel.com/blog/best-cities-urban-stargazing/World Air Quality Ranking. (2023) IQAir., Retrieved Nov. 30, 2023, from
https://www.iqair.com/us/world-air-quality-rankingUnemployment Rate in Minneapolis-St. Paul-Bloomington, MN-WI. (November 2023) Federal Reserve Bank of St. Louis., Retrieved Nov. 30, 2023, from
https://fred.stlouisfed.org/series/MINN427URNCampisi, N. (2023). Unemployment Rates By City: See Your City’s Rank. Forbes.,, Retrieved Nov. 30, 2023, from
https://www.forbes.com/advisor/personal-finance/unemployment-rates-by-city/Wickramasinghe, H., & Anholm, J. D. (1999). Sleep and Breathing at High Altitude. Sleep & breathing = Schlaf & Atmung, 3(3), 89–102., Retrieved Nov. 30, 2023, from
https://pubmed.ncbi.nlm.nih.gov/11898114/O’Connell-Domenech, A. (2023). Here are the noisiest cities in the U.S. The Hill.,, Retrieved Nov. 30, 2023, from
https://thehill.com/changing-america/sustainability/infrastructure/4062973-here-are-the-noisiest-cities-in-the-u-s/Unemployment Rate in Detroit-Warren-Dearborn, MI. (November 2023). Federal Reserve Bank of St. Louis., Retrieved Nov. 30, 2023, from
https://fred.stlouisfed.org/series/DETR826URNTop 50 Bed Bug Cities in the U.S. (2023). Terminix., Retrieved Jan 19, 2024, from
https://www.terminix.com/blog/whats-buzzing/top-bed-bug-cities/Kollath Wells, C., Fitzpatrick, A. (2023). New Orleans’ median household income drops., Retrieved Nov. 30, 2023, from
https://www.axios.com/local/new-orleans/2023/09/20/median-average-income-drops-falls-map-chart